On July 8, NASA’s ECOSTRESS instrument, attached to the
International Space Station, captured ground surface temperature
data over California. In the image (middle image), areas in red –
including Death Valley – had surpassed 86 degrees Fahrenheit (30
degrees Celsius) by 7 a.m. local time, well above average ground
surface temperatures for the area.
On July 9, Death
Valley recorded a high air temperature of 130 F, which fell just a
few degrees short of the official all-time surface air temperature
record of 134 F set in 1913. On July 11, Bishop, California, hit
an all-time high of 111 F and Stovepipe Wells, California, set a
new record for daily average temperature with 118 F. Numerous
other daily, monthly, and all-time records were set throughout the
inland areas of central and Southern California and northern
Arizona.
In some regions, rivers and lakes are so polluted that they are
literally catching fire. Prime examples include the Bellandur Lake
in Bangalore, India, which has carried ash onto buildings up to
six miles away.
The report estimates that the world is
losing enough food to feed 170 million people each year – the
equivalent of the population of Bangladesh – due to increase
salinity, or salt content.
The report recommends a set of actions that countries can take to
improve water quality, including improving environmental policies
and standards; accurate monitoring of pollution levels; effective
enforcement systems; water treatment infrastructure supported with
incentives for private investment; and reliable, accurate
information disclosure to households to inspire greater civic
engagement.
Since the Industrial Revolution, the global annual temperature has
increased in total by a little more than 1 degree Celsius, or
about 2 degrees Fahrenheit. Between 1880—the year that accurate
recordkeeping began—and 1980, it rose on average by 0.07 degrees
Celsius (0.13 degrees Fahrenheit) every 10 years. Since 1981,
however, the rate of increase has more than doubled: For the last
40 years, we’ve seen the global annual temperature rise by 0.18
degrees Celsius, or 0.32 degrees Fahrenheit, per decade.
The result? A planet that has never been hotter. Nine of the 10
warmest years since 1880 have occurred since 2005—and the 5
warmest years on record have all occurred since 2015. Climate
change deniers have argued that there has been a “pause” or a
“slowdown” in rising global temperatures, but numerous studies,
including a 2018 paper published in the journal Environmental
Research Letters, have disproved this claim. The impacts of global
warming are already harming people around the world.
Climate change can impact air quality and, conversely, air quality
can impact climate change.
Changes in climate can result in impacts to local air quality.
Atmospheric warming associated with climate change has the
potential to increase ground-level ozone in many regions, which
may present challenges for compliance with the ozone standards in
the future. The impact of climate change on other air pollutants,
such as particulate matter, is less certain, but research is
underway to address these uncertainties.
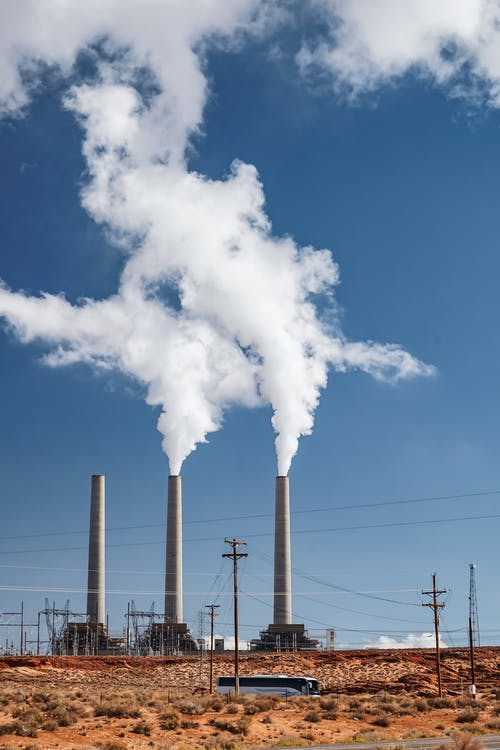
Emissions of pollutants into the air can result in changes to the
climate. Ozone in the atmosphere warms the climate, while
different components of particulate matter (PM) can have either
warming or cooling effects on the climate. For example, black
carbon, a particulate pollutant from combustion, contributes to
the warming of the Earth, while particulate sulfates cool the
earth's atmosphere.
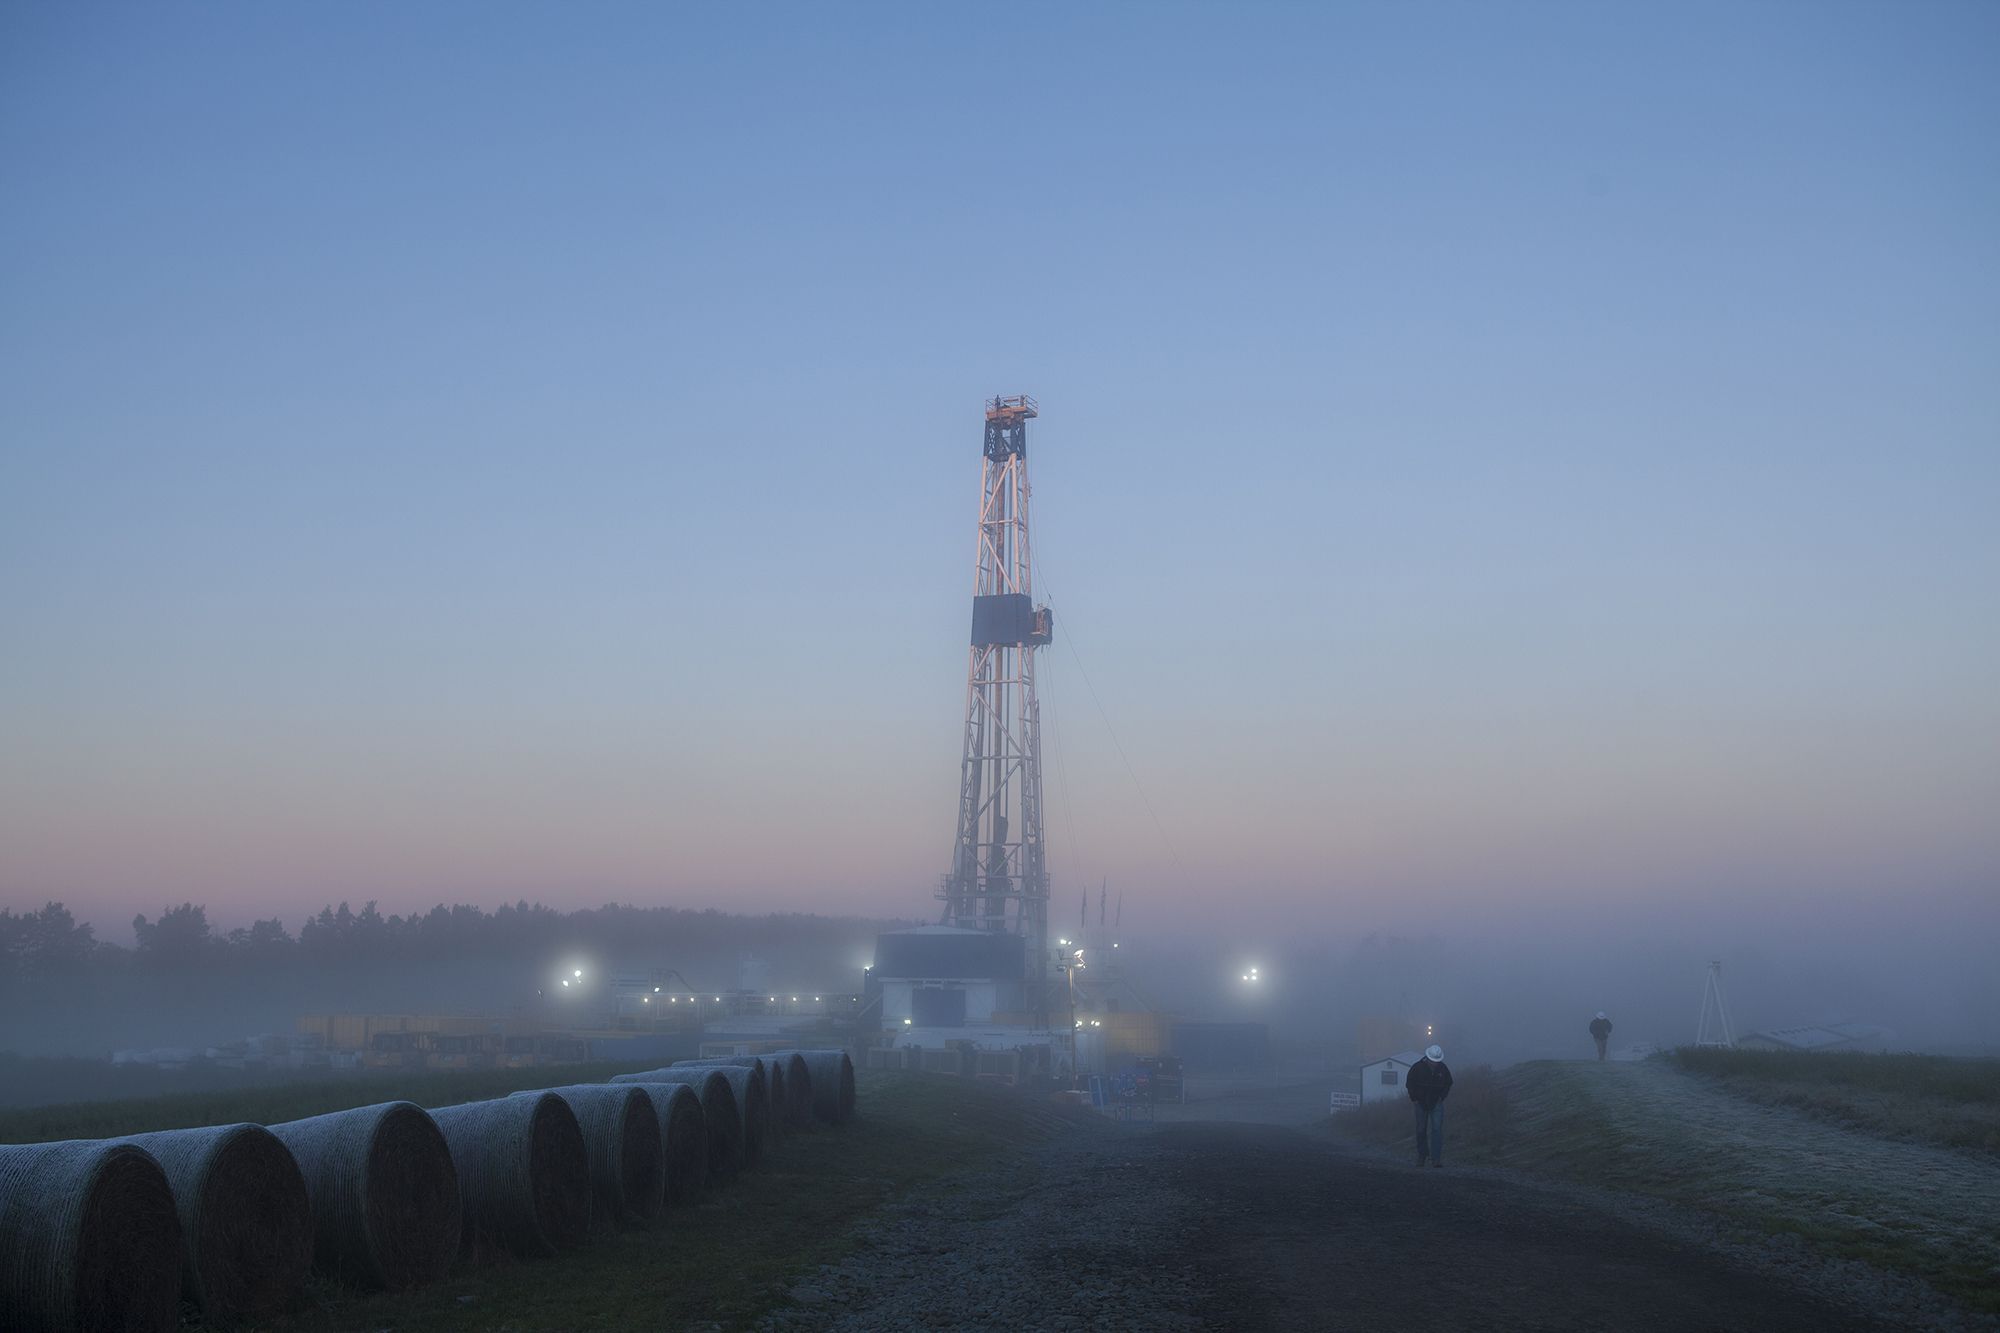
Fracking Tower
Fracking is a controversial form of drilling that uses high-pressure liquid to create cracks in underground shale to extract natural gas and petroleum. Carbon emissions from fossils fuels like these have been linked to global warming and climate change.
PHOTOGRAPH BY MARK THIESSEN / NATIONAL GEOGRAPHIC
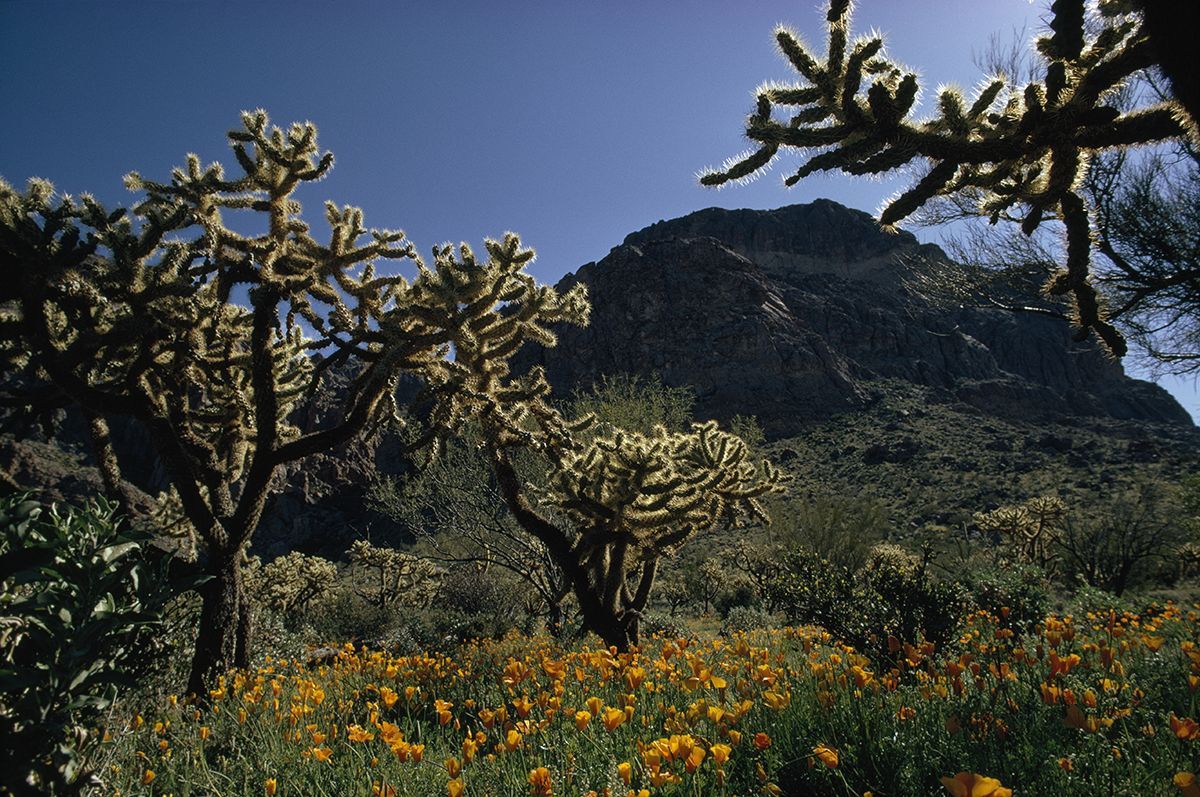
Climate
Climate is the long-term pattern of weather in a particular area. Weather can change from hour-to-hour, day-to-day, month-to-month or even year-to-year. A region’s weather patterns, usually tracked for at least 30 years, are considered its climate.
PHOTOGRAPH BY WALTER MEAYERS EDWARDS, NATIONAL GEOGRAPHIC